
KNOWLEDGE CENTER
Daily Idling Rate
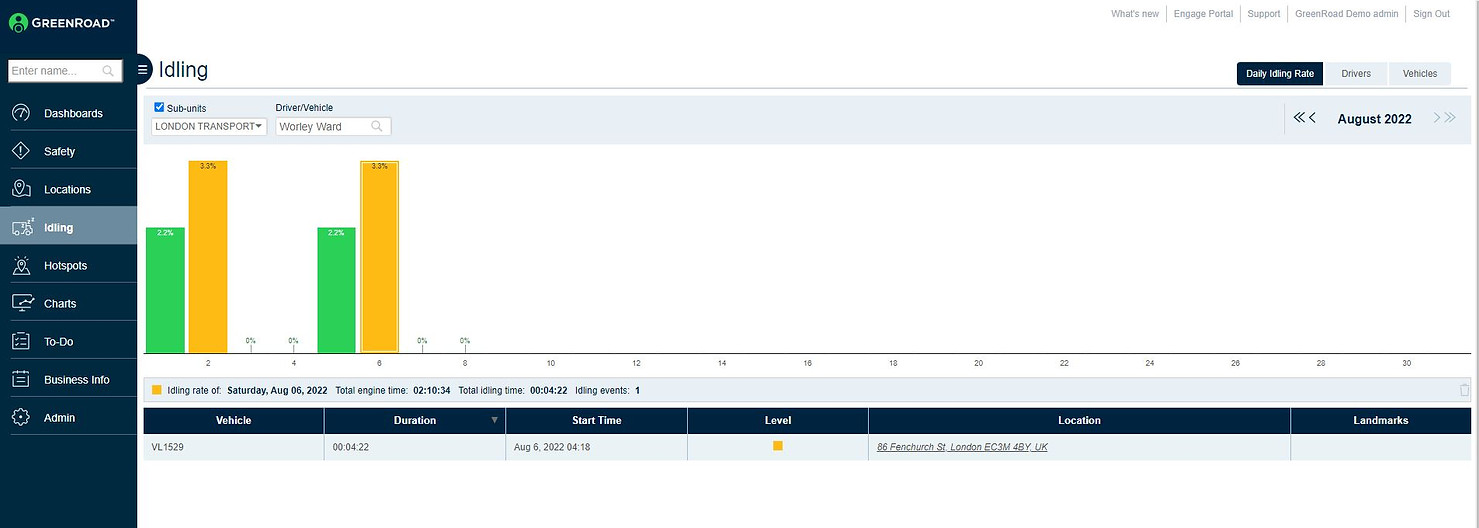
Enter a driver or vehicle into the text box in the menu above the graph. Each bar represents a single day's aggregated data. The overall idling percentage is displayed on the bar, and the severity level is indicated by the bar's color: green, yellow or red.
Clicking on a single day will display a list of all the idling events that occurred that day in the table below. For each idling event, the color indicates its severity rating (yellow or red), and its duration, start time and location are also listed. Also noted is whether the location is part of an area defined as a landmark.
Managers with designated permissions are able to delete individual idling events. These deletions and their reason codes are logged and aggregated in the 'Deleted Idling Events Log' report available in GreenRoad Central™.